
The simple payback formula (Cost / Annual Savings) is fundamentally flawed because it ignores critical real-world variables that can erase your expected returns.
- The advertised efficiency of an appliance is only a baseline; its actual performance is degraded by installation errors, usage habits, and phantom power draw.
- Factors like longer cycle times on efficient machines have a quantifiable time cost, and premature failure from improper sizing can negate any potential savings.
Recommendation: To make a sound financial decision, you must calculate the Total Cost of Ownership using a comprehensive equation that includes energy, maintenance, time, and performance decay variables.
You’re standing in front of your aging refrigerator, the one that’s been humming along for 15 years. It works, but the energy label from its era is a relic. A new A+++ model promises significant annual savings, and the math seems simple: divide the purchase price by the estimated yearly energy savings to find the payback period. This is the common advice, the quick calculation everyone performs. But as a home energy auditor, I can tell you this calculation is dangerously incomplete. It’s a financial platitude that ignores the most significant factors determining an appliance’s true cost.
The standard formula fails to account for performance degradation over time, the hidden energy cost of “smart” features in standby mode, or how your personal usage habits can slash advertised efficiency. It doesn’t quantify the financial impact of a heat pump dryer that takes 30 minutes longer per load or an oversized air conditioner that fails five years early. These aren’t minor details; they are critical variables in what I call the Real Payback Equation. This is the difference between a smart investment and a costly mistake.
This article will deconstruct that simplistic formula. We will move beyond the sticker price and the kWh rating to build a comprehensive financial model. We will analyze the hidden costs and overlooked benefits, providing you with the tools to calculate the true payback period and make a decision based on a complete financial picture, not just an optimistic marketing promise.
To equip you with a truly analytical framework, this guide breaks down the essential variables of the Real Payback Equation. Each section tackles a different, often-ignored factor that you must consider before upgrading an appliance, providing a step-by-step method for a comprehensive cost-benefit analysis.
Summary: Calculating the Real Payback Period of Your Appliances
- Why Heat Pump Dryers Save 50% Energy But Take Longer to Dry?
- How to Find Devices Stealing Electricity When Turned Off?
- Gas or Induction: Which Is More Efficient for Daily Cooking?
- The Sizing Mistake That Makes Your AC Unit Break Down Faster
- Loading the Fridge: How Airflow Impact Your Energy Bill?
- Why Does Your Smart Home Increase Electricity Usage in Standby Mode?
- How to Find Drafts in Your House With a Stick of Incense?
- How to Lower Your Heating Bill by 20% Using Smart Thermostats?
Why Heat Pump Dryers Save 50% Energy But Take Longer to Dry?
The first variable to add to our Real Payback Equation is the “time-as-a-cost” factor, perfectly illustrated by heat pump dryers. These appliances are remarkably efficient, recycling hot air instead of venting it outside. This process allows them to use significantly less energy. However, this efficiency comes at a non-financial cost: longer drying times. While older condenser dryers might finish a load in 60 minutes, a heat pump model can take 90 minutes or more for the same load. For a budget-conscious homeowner, the question becomes: what is the financial value of that extra 30 minutes?
To quantify this, you must assign a dollar value to your time. If you do laundry five times a week, that’s an extra 2.5 hours weekly, or 130 hours per year. If you value your time at even a modest $15/hour, that’s a “time cost” of $1,950 per year, which could dwarf the energy savings. However, recent advancements are closing this gap. An ENERGY STAR assessment shows certified models now have typical drying times between 37-70 minutes, making them much more competitive. These models can save over $500 in energy costs over their lifetime.
The calculation is therefore a trade-off. You must weigh the concrete, guaranteed energy savings against the subjective but very real cost of your time. If the dryer runs overnight while you sleep, the extra time has a cost of zero. If it delays your daily schedule, the cost is significant. This is the first step in moving beyond the simple kWh calculation: acknowledging and quantifying the operational impacts of an appliance on your life.
How to Find Devices Stealing Electricity When Turned Off?
The next variable in our equation is “phantom load” or “vampire power”—the electricity consumed by devices when they are turned off or in standby mode. For a single appliance, this might seem negligible. But across a whole home, these silent costs add up, slowly eroding the savings promised by your new A+++ appliance. A modern smart TV, with its Wi-Fi connection and instant-on features, can draw significantly more power in standby than its “dumb” predecessor. The same is true for coffee makers, game consoles, and computer monitors.
Identifying these energy vampires is a critical step in any home energy audit. The most effective tool for this is a simple plug-in watt meter. By connecting each device through the meter, you can measure its exact power draw in every state: on, idle, and “off.” You might be shocked to discover that your entertainment center or home office setup consumes 20-30 watts continuously, 24/7. This translates to real money on your utility bill, effectively acting as a hidden tax on your modern conveniences.

Quantifying this phantom load is essential for our Real Payback Equation. The table below, based on data comparing traditional and smart devices, illustrates how these small amounts accumulate. The additional annual cost from smart features in standby mode can directly offset a portion of the efficiency gains you expect from a new appliance. Before calculating payback, you must audit your home’s phantom load to establish a true energy consumption baseline.
| Device Type | Traditional Model (Watts) | Smart Model (Watts) | Annual Cost Difference |
|---|---|---|---|
| Television | 1-3W | 7-10W | +$8/year |
| Desktop Computer | 2-4W | 9.5W | +$9/year |
| Game Console | 1W | 11W (instant-on) | +$12/year |
| Coffee Maker | 1W | 3-6W | +$5/year |
Gas or Induction: Which Is More Efficient for Daily Cooking?
When considering a kitchen upgrade, the choice between a gas and an induction cooktop introduces another layer to our Real Payback Equation: energy transfer efficiency and fuel cost volatility. A gas cooktop feels direct and is familiar to many, but it’s fundamentally inefficient. A significant amount of the heat produced by the flame dissipates into the air, heating your kitchen instead of your pan. Typically, a gas stove is only about 40% efficient at transferring energy to the food.
Induction cooktops, in contrast, are a model of efficiency. They use magnetic fields to directly heat the cookware itself, with almost no waste heat. This results in an energy transfer efficiency of around 85-90%. This means more of the energy you pay for is actually used for cooking, leading to faster boiling times and lower energy consumption per meal. However, the initial cost of an induction cooktop is often higher than its gas counterpart, and it may require purchasing new, compatible cookware.
To solve this part of the equation, you must compare the lifetime operational costs. This involves looking at the current and projected costs of natural gas versus electricity in your region. Furthermore, the payback period must feel reasonable. Most consumers are only willing to wait so long for a return on their investment. Your personal threshold for an acceptable payback period is a key psychological factor in the decision. The initial higher cost of induction must be offset by tangible energy savings within a timeframe that makes financial sense to you.
The Sizing Mistake That Makes Your AC Unit Break Down Faster
Perhaps the most critical and financially devastating variable in the Real Payback Equation is “Lifecycle Efficiency,” which is determined by proper installation and sizing. This is especially true for HVAC systems. You can purchase the most efficient A+++ air conditioner on the market, but if it’s the wrong size for your home, you will never achieve the advertised savings. In fact, you might end up paying more in the long run.
An oversized AC unit is a common and costly mistake. It cools the space too quickly, leading to short, frequent cycles. This “short-cycling” prevents the system from running long enough to effectively dehumidify the air, leaving you feeling cool but clammy. More importantly, the constant starting and stopping puts immense strain on the compressor, the heart of the unit. This leads to premature wear and tear, causing breakdowns and drastically shortening the appliance’s expected 15-20 year lifespan. A unit that fails 5-10 years early has a payback period of infinity—it never pays for itself.
The correct method for sizing an HVAC system is a Manual J calculation, a detailed analysis performed by a qualified technician that considers your home’s square footage, insulation, window types, air leakage, and local climate. As the following table shows, the financial consequences of improper sizing are severe. An oversized unit not only operates less efficiently but is also destined for an early grave, completely negating any potential return on investment.
An analysis from HVAC professionals demonstrates how quickly the ROI diminishes with improper sizing. The following table, based on their findings, shows that even a slightly oversized unit extends the payback period, while a significantly oversized one will likely fail before it ever breaks even. This data underscores the critical importance of proper installation for achieving any energy savings.
| Sizing Accuracy | Expected Lifespan | Actual Efficiency | Real Payback Period |
|---|---|---|---|
| Properly Sized (Manual J) | 15-20 years | 100% of rated SEER | 5-7 years |
| 10% Oversized | 12-15 years | 85% of rated SEER | 8-10 years |
| 20% Oversized | 8-10 years | 70% of rated SEER | Never achieves payback |
Loading the Fridge: How Airflow Impact Your Energy Bill?
Even with a perfectly sized and installed A+++ appliance, your daily habits can significantly add to or subtract from your energy savings. The modern refrigerator is a prime example. The difference in raw consumption between old and new models is staggering; according to Department of Energy data, a 1990s-era refrigerator can use 1,100 kWh per year, while a new, efficient model might use only 350 kWh. However, you can easily squander those savings by mismanaging the appliance.
Refrigerators work by circulating cold air. If you overstuff your fridge, blocking air vents and packing items tightly together, you disrupt this critical airflow. The compressor then has to work much harder and longer to maintain a consistent temperature, consuming more electricity. Conversely, an empty fridge is also inefficient. It lacks “thermal mass”—the cooled items that help maintain the temperature when the door is opened. The ideal state is a fridge that is 70-80% full, with adequate space between items for air to circulate freely.
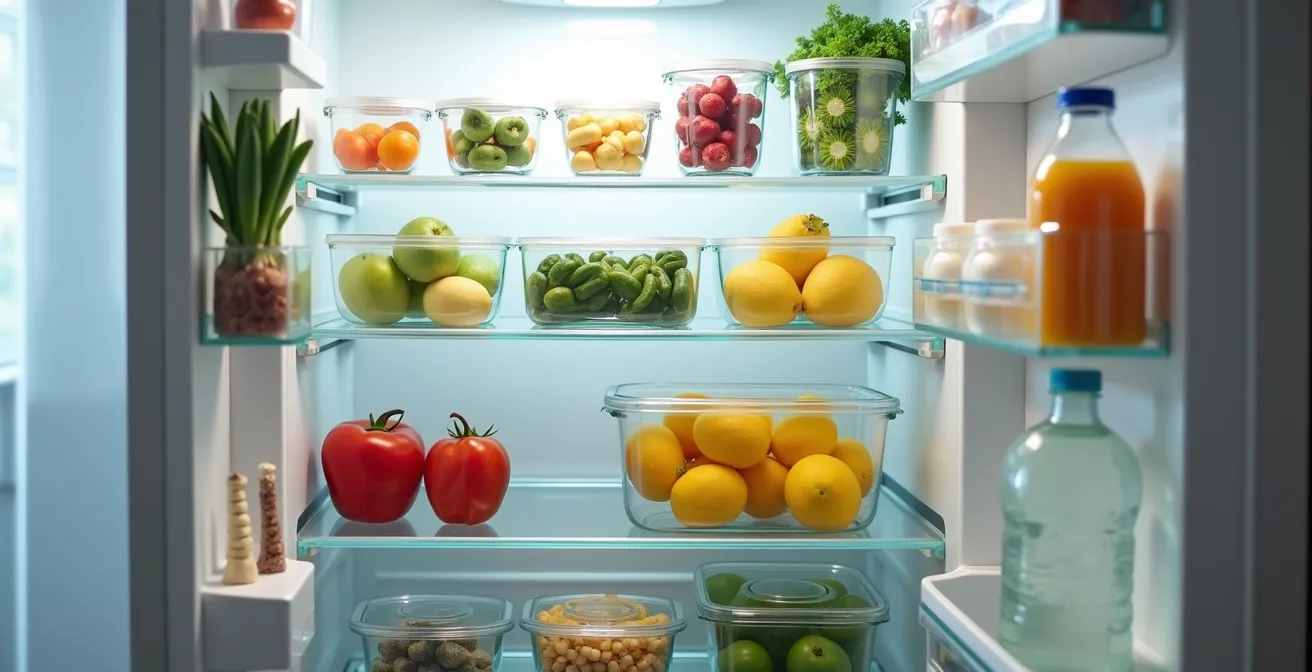
This “usage efficiency” is a tangible variable. By simply reorganizing your refrigerator to optimize airflow and pre-cooling hot leftovers before storing them, you can reduce its energy consumption. Mapping the different temperature zones—the top shelf being slightly warmer, the bottom coldest—and storing foods accordingly also improves efficiency and food preservation. Your behavior is not a passive factor; it is an active component of the Real Payback Equation.
Why Does Your Smart Home Increase Electricity Usage in Standby Mode?
The rise of the smart home introduces a new and complex variable into our payback calculations. While individual smart devices promise convenience and efficiency, their collective energy footprint can be surprisingly large, primarily due to their “always-on” nature. A smart home is never truly off. Hubs, speakers, plugs, and the appliances themselves are constantly connected to your Wi-Fi network, listening for commands and communicating with the cloud. This standby consumption, as we’ve seen, is a form of phantom load.
The architecture of your smart home system plays a significant role in this hidden cost. Cloud-based systems, like those reliant on Amazon Alexa or Google Nest, depend on a constant internet connection for each device to function. This means your router, the smart device, and the servers in a data center are all consuming power to keep your home operational. In contrast, local control systems that use protocols like Zigbee or Z-Wave communicate through a central, low-power hub within your home. While the hub is always on, the individual devices consume far less energy in standby and can operate even if your internet goes down.
As the table below illustrates, the cumulative annual cost of standby power for a cloud-dependent smart home can be significant. This ongoing operational cost must be factored into the payback period of any “smart” A+++ appliance you purchase. The convenience of voice commands comes with a small but continuous energy bill that can eat into your expected savings over the appliance’s lifetime.
| Control Type | Annual Standby Cost | Always-On Requirements | Privacy Level |
|---|---|---|---|
| Cloud-Based (Alexa, Nest) | $50-80/year | WiFi router + device + cloud | Low |
| Local Hub (Zigbee/Z-Wave) | $20-30/year | Hub only | High |
| Hybrid Systems | $35-55/year | Variable | Medium |
How to Find Drafts in Your House With a Stick of Incense?
No appliance operates in a vacuum. The efficiency of your heating, cooling, and refrigeration systems is directly impacted by the integrity of your home’s “envelope”—its walls, windows, doors, and insulation. Air leaks, or drafts, are the enemy of efficiency. They allow conditioned air to escape and unconditioned air to infiltrate, forcing your HVAC system and refrigerator to work harder to maintain the desired temperature. Calculating the payback of a new AC unit without first addressing air leaks is like trying to fill a leaky bucket.
Finding these leaks doesn’t require expensive equipment. A simple stick of incense is a surprisingly effective auditing tool. On a cool, calm day, turn off your HVAC system and any fans. Close all windows and doors. Light the incense stick and slowly pass it along the edges of windows, door frames, electrical outlets, and any other potential points of leakage. If the smoke flows horizontally, you have a significant draft. A slight waver indicates a smaller leak. Each of these leaks represents a constant, year-round energy loss.
Sealing these drafts with caulk, weatherstripping, or foam gaskets is one of the most cost-effective energy improvements you can make. It’s a foundational step that amplifies the savings from any high-efficiency appliance you install. The following audit plan provides a systematic way to turn draft detection into measurable financial savings, ensuring your investment in a new appliance isn’t wasted fighting preventable energy loss.
Action Plan: From Draft Detection to Dollar Savings
- Identify Contact Points: Light an incense stick and hold it 1 inch from potential leak sources like window frames, door seals, and electrical outlets.
- Quantify the Leak: Observe the smoke’s movement. A slight waver indicates a small air loss (approx. 0.5 CFM), while smoke moving horizontally signals a major leak (2+ CFM).
- Calculate Heat Loss: Use the formula: CFM × 1.08 × (Inside Temp – Outside Temp) × Hours to estimate the energy (BTU) loss per leak.
- Convert to Annual Cost: Multiply the BTU loss by your local heating degree days and the cost of your heating fuel to get a dollar value for each draft.
- Prioritize and Seal: Start by sealing the largest CFM leaks first to achieve the maximum return on investment for your time and materials.
Key Takeaways
- The true payback of an efficient appliance is determined by a “Real Payback Equation,” not a simple cost-versus-savings formula.
- Factors like improper sizing, phantom power draw, and inefficient usage patterns can completely negate an appliance’s advertised energy savings.
- A comprehensive energy audit, including quantifying the cost of time and sealing air leaks, is necessary before calculating a realistic return on investment.
How to Lower Your Heating Bill by 20% Using Smart Thermostats?
After accounting for all the hidden costs, performance variables, and structural inefficiencies, the final piece of the Real Payback Equation is optimization. This is where a smart thermostat becomes a powerful tool. It acts as the “brain” of your HVAC system, capable of mitigating many of the inefficiencies we’ve discussed. A smart thermostat doesn’t just set a temperature; it executes a strategy. The U.S. Department of Energy estimates they can save up to 15% on heating and cooling costs, but with intelligent use, the savings can be even greater.
The true power of a smart thermostat lies in its ability to adapt to your specific lifestyle, maximizing savings without sacrificing comfort. For a commuter, the geofencing feature automatically lowers the temperature when you leave and raises it as you approach home. For someone with an unpredictable schedule, a model with a learning algorithm can build a custom heating and cooling schedule based on your actual patterns of occupancy. By precisely controlling when your HVAC system runs, a smart thermostat ensures you are not paying to heat or cool an empty house, directly tackling the largest source of energy waste.
The return on investment for a smart thermostat is often one of the fastest of any home energy upgrade. As the following table based on real-world user data from an energy efficiency agency shows, the payback period can be as short as a few months, depending on your usage profile. It is the final, crucial step in ensuring your investment in an efficient home pays dividends.
| User Profile | Best Feature | Annual Savings | Payback Period |
|---|---|---|---|
| The Commuter | Geofencing | $250-350 | 8-12 months |
| Work-From-Homer | Smart Scheduling | $150-200 | 12-16 months |
| Erratic Scheduler | Learning Algorithm | $200-300 | 10-14 months |
| Vacation Home Owner | Remote Control | $300-500 | 6-10 months |
Ultimately, calculating the real payback period requires you to think like an auditor. You must move beyond the sticker price and assemble the full equation. By quantifying phantom loads, accounting for installation quality, analyzing your own usage patterns, and leveraging smart technology, you can make a truly informed financial decision that guarantees long-term savings.